INTRODUCTION
This follow-on, quantitative study sought to fill a gap in research, specifically in satisfaction with owning and operating a franchise. Franchising is one prevalent way of pursuing entrepreneurship. According to the Small Business Administration (2020), 31.7 million small businesses were in the United States in 2017. Moreover, roughly five percent or one in 20 businesses with employees in the United States were operating under the franchise model. Statista Research Department (2022) reported that the franchise industry had approximately 753,770 establishments in 2020. While franchising is a popular means of growing an organization and pursuing entrepreneurship, the franchise model comes with challenges. For example, franchisors don’t always make the best selection when accepting candidates to utilize their franchise system. Moreover, aspiring franchisees sometimes make the wrong choice when selecting an industry and brand that best matches their strengths, skills, knowledge, and passion. As a result, some entrepreneurs find themselves dissatisfied with franchising.
This study aims to determine the impact of industry choice and age on success and satisfaction. While previous research has addressed the impact of industry choice and age on non-franchisee entrepreneurs, more is needed to know how these variables impact franchising. This study attempts to fill a gap in this research. According to Knatko et al. (2016), many scholarly studies on entrepreneurship infrequently address industry choice as a part of the entrepreneurial decision-making process. Moreover, scholarly literature on entrepreneurship has discovered that capital influences justify industry selection. Hipple and Hammond (2016) note that raising financial capital for their entrepreneurial endeavors is one of the most considerable challenges for younger entrepreneurs. Lower capital makes it more difficult for younger cohorts to acquire a franchise because it is often a more considerable investment than other entrepreneurial opportunities.
Resource scarcity theory might explain the impact of age and the selection of industry on franchising. According to Castrogiovanni et al. (2006), Oxenfeldt and Kelly (1969) first discussed resource scarcity theory. Cetindamar et al. (2012) proposes that the decision to become or not become an entrepreneur is based on access or possession of resources. Knatko et al. (2016) suggest there is a direct relationship between resource access and industry choice. In addition, the essential resources for successful entrepreneurship are access to financial and human capital and the experience and know-how acquired by an entrepreneur. In addition, resource scarcity might explain the type of industry chosen to pursue entrepreneurship. For example, some industries are considered low-cost investments in franchising, while others can be a significant financial outlay. Moreover, some franchise models require a certain level of experience for some industries. Experience is often a byproduct of age.
Resource scarcity theory also describes how franchising can benefit from resources that might be deficient in an organization, such as tangible or intangible capital (Barney, 1991; Castrogiovanni et al., 2006; Inma, 2005; Michael & Combs, 2008). According to Michael and Combs (2008), resource scarcity theory suggests franchising offers a shared benefit of resources to both the franchisee and the franchisor. Moreover, resource scarcity theory suggests an organization uses franchising to increase capital and better understand local markets while decreasing managerial influence. According to Inma (2005), the franchisee provides financial capital for business growth through a fixed fee and royalty rate.
Our research questions for this study are the following: First, are there significant differences in job satisfaction in owning and operating a franchise within different industries? If significant differences in job satisfaction are found between industry categories, where are the differences between each category? Next, does age impact job satisfaction in owning and operating a franchise? If significant differences in job satisfaction are found between ages, where are the differences between cohorts? The following section will describe several problems with franchising.
Problem Background
This research focused on several problems relating to franchising. Franchising is unique in terms of entrepreneurship because it includes two different types of entrepreneurs. The first type of entrepreneur is the franchisor, the creator of the business model and brand. Next is the franchisee, the individual who follows the system created by the franchisor. While both entrepreneurs are different in traits and job functions, they depend on each other to succeed. Franchisees are crucial in thriving franchise organizations (Michael & Combs, 2008). Pursuing this further, Ramirez-Hurtado et al. (2011) propose that the correct choice of a potential franchisee can produce positive outcomes for the franchisor. Consequently, a poor selection of a potential franchisee can cause persistent problems for the franchise organization, such as legal issues or hurting the brand. Moreover, Altinay and Okumus (2010) suggest poor franchise recruitment can lead to a lack of commitment and dissatisfaction.
While the franchising model offers some distinct benefits to entrepreneurs, such as an established system, recognized brand, training, and economies of scale, it does not guarantee that entrepreneurs will succeed or be satisfied with franchising. Carree and Verheul (2012) suggest that the business ownership experience fails to meet many entrepreneurs’ expectations. As a result, many of these individuals are dissatisfied with their decision to pursue entrepreneurship. One of the earliest studies identified on franchisee satisfaction was research by Morrison (1996). Morrison’s findings indicated that approximately 50% of the franchisees analyzed reported low job satisfaction. According to Orhan et al. (2016), one of the most difficult correlations between organizational behavior is performance and job satisfaction. This difficulty occurs since the functionality can be challenging to determine. However, a substantial volume of studies proposes that performance is a result of job satisfaction (Abraham, 2012; Ahmed & Ahmad, 2011; Argyle, 1989; Judge et al., 2001; Robbins et al., 1998; Schneider, 1987). Abraham (2012) suggests that job satisfaction is a practical measuring tool. High levels of job satisfaction are often associated with lower turnover, higher engagement, enhanced productivity, more loyal customers, a higher level of motivation, and more dedication to the job (McDermott & Butler, 2018). Therefore, it would be reasonable to suggest that low job satisfaction produces high employee turnover, lower engagement, and decreased productivity, impacting the financial performance of the franchisee. The following section will describe the conceptual framework for this study.
Conceptual Framework
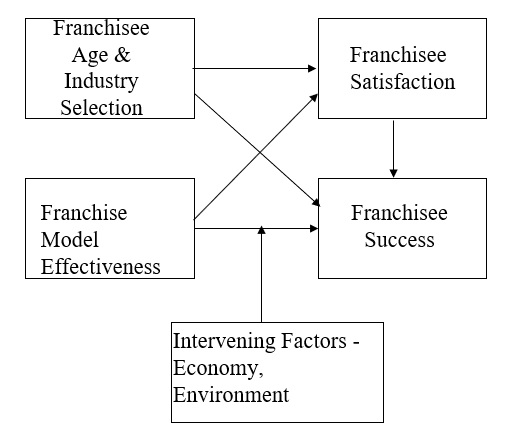
The theoretical underpinning of this paper focuses on the impact of industry choice and age on franchisee success and job satisfaction. As shown in Figure 1, this research focuses on the intrinsic or extrinsic factors of age and industry choice, proceeded by the decision to become an entrepreneur and, more specifically, a franchise business owner.

The context of this research is based on age cohort and industry, providing a better opportunity or challenge of being an entrepreneur and, more precisely, a satisfied and successful franchisee.
Significance of Study
Franchising plays an essential role in the U.S. economy. According to Statista Research Department (2022), the economic output of franchise establishments in the United States in 2020 was about 670 billion U.S. dollars. Contributing to the economic output of franchise establishments in the United States were about 7.49 million people who worked for a franchise business.
From a practical perspective, Morrison (1996) indicates that amicable franchisor/franchisee relationships are a key determinant of the future success of a franchise. Moreover, it is anticipated that franchisees’ relative job satisfaction plays an essential role in maintaining this relationship. The notion behind this research is that if aspiring entrepreneurs have more accurate expectations, they will be more successful (Carree & Verheul, 2012). This study is significant because it relates previous experience to more accurate expectations, which can be argued are better reflected by satisfaction, the difference between expectations and results (Parasuraman et al., 1988). Therefore, the relevant question for entrepreneurs, franchisors, policymakers, and business lenders is whether this knowledge is constructive in identifying “better” opportunities. This research addresses this question and looks at the impact of industry choice and age cohort on satisfaction because there is a stronger relationship between those constructs.
Literature Review
The researchers will synthesize previous literature on franchisee satisfaction. Next, we review two areas relating to resource scarcity theory. First, we will explore relevant literature on entrepreneurship and industry selection. This literature review will also include previous research on the impact of age on entrepreneurship.
Franchise Satisfaction
Some studies have explored the relationship between satisfaction and successful franchising (McDermott et al., 2015; McDermott & Boyd, 2017; McDermott & Butler, 2018; McDermott & Jackson, 2020; Morrison, 1996). One of the earliest studies identified on franchisee satisfaction was conducted by Morrison (1996). This study revealed that nearly half of the franchise business owners analyzed reported low job satisfaction. Several areas of dissatisfaction were identified in owning and operating a franchise, including continued support from the franchisor, advertising assistance, and income levels generated.
Next, according to Crecente et al. (2020), “one of the most definitive quantitative studies on the link between franchising and military education was presented in 2015 by McDermott, Boyd, and Weaver. This study reveals that military veterans’ overall job satisfaction in owning and operating a franchise was significantly higher than those franchise business owners who had not served in the military.” (pg. 2).
In addition, a follow-on study by McDermott and Boyd (2017) explored the influence of human capital on franchise business ownership and job satisfaction. This study applied a comparative research model to assess whether education and previous business ownership experience impact satisfaction levels on franchise ownership. Findings reported in this study indicated that, in contrast to research findings on non-franchisee entrepreneurs, higher levels of education were not correlated to higher satisfaction in owning and operating a franchise. Additional findings indicated that franchisees who had not owned a business before purchasing their franchise had significantly higher job satisfaction than those who owned a company before buying a franchise (McDermott & Boyd, 2017).
Another follow-on study conducted by McDermott and Butler (2018) explored the influence of gender on franchise business ownership using job satisfaction as a dependent variable to measure success. Findings reported in this study indicated that fewer women pursue a franchise than men of the several franchise categories studied. Additional results reported that, in contrast to research findings on non-franchisee entrepreneurs, gender was not correlated to satisfaction in owning and operating a franchise.
Lastly, a follow-on, qualitative study conducted by McDermott and Jackson (2020) explored why franchisees with a military background had higher job satisfaction than franchisees who had not served in the military. This study answered essential questions like how military experience influences satisfaction in owning and operating a franchise. Findings reported in this study suggested that franchisees with a military background appreciated the positive aspects of systems within the franchise paradigm; however, they had strong negative feelings towards bureaucracy. In addition, the veterans regarded their prior learning related to military experience and leadership and remarked it as a critical factor towards successful business ownership and franchise leadership. While these previous studies made several notable contributions to scholarly franchise research, they did not address important independent variables like industry choice and age of the franchise business owner, which could lead to a difference if one is satisfied and successful in owning and operating a franchise.
Industry
Industry selection is one of several essential considerations in starting a business or buying a franchise. Kotler and Keller (2016) describe an industry as “a collection of organizations offering a good or service or a group of products that are close alternatives to one another” (pg. 277). A common practice for many organizations and aspiring entrepreneurs is initially assessing direct competitors in an industry. However, Kotler and Keller (2016) propose that the ratio of actual and potential competitors is much broader than the obvious in most instances. Moreover, companies are more likely to be burdened by developing rivals or innovative technologies than direct competitors.
According to Knatko et al. (2016), most scholarly studies on entrepreneurship infrequently address industry choice as a facet of the entrepreneurial decision-making process. According to Shane (2008), many entrepreneurs need to make better choices when starting a venture because they open businesses in industries with an elevated level of competition. Moreover, these industries usually mirror competitors, have smaller profit margins, and have lower growth rates. With two explanations, Shane also suggests that numerous entrepreneurs have historically selected less-appealing industries. First, many individuals have a greater comfort level in industries they are acquainted with and have experience. For example, hair stylists open hair salons, and chefs open restaurants. The second explanation is that many entrepreneurs select industries with low entry barriers.
Scholarly literature on entrepreneurship has also identified capital factors as a reason for industry selection. According to Cetindamar et al. (2012), people’s possibility of becoming entrepreneurs is persuaded by their access to valuable and distinctive resources. Knatko et al. (2016) suggest that human and financial capital are the most significant resources available to entrepreneurs. Russ (2015) defines human capital as “the knowledge, experience, and skills held by an individual, seen in their value or expense to an organization.” (pg. 1). Cetindamar et al. (2012) also suggests that human capital is established in the notion that individuals have skills, experience, and knowledge that have economic value. According to Schwienbacher (2007), financial capability also plays a crucial role in entrepreneurial decision-making. Moreover, the failure to access mandatory financing is a mutual cause for exiting a career in entrepreneurship (Knatko et al., 2016).
Limited research has focused on the relationship between industry choice and entrepreneurship. Nevertheless, Knatko et al. (2016) found several correlations between entrepreneurship and industry selection. First, there is a direct link between access to resources and industry choice. However, the country profile may significantly adjust this relationship. Also, entrepreneurs with higher human capital typically steer towards knowledge-intensive industries, while those with higher financial capital select more capital-intensive industries. Next, in innovation-driven countries, an undergraduate education level increases the probability of entering a knowledge-intensive industry, while a doctoral-level steer toward capital-intensive industries. According to Knatko et al. (2016), one possible explanation for this finding is that younger individuals might be more receptive to knowledge spillovers and have a more innovative spirit. Moreover, older individuals are more prone to enter less risky or traditional capital-intensive industries. Therefore, having specific resources is critically important to explain industry selection. The following section will provide a brief review of the impact of age on entrepreneurship.
Age
In the United States, there are several distinct age cohorts pursuing entrepreneurship. Small (2012) states that entrepreneurship can occur at any societal level. Moreover, Minola et al. (2016) suggest that macro-changes in the business environment indicate that self-employment as a possible career choice is now available to a broader spectrum of the adult population. Studies suggest age is a factor in industry selection (Bohlmann et al., 2017; Hipple & Hammond, 2016; Knatko et al., 2016; Rogoff, 2007; Shane, 2008). This notion results from access to resources like financial and human capital factors. Rogoff (2007) suggests that older entrepreneurs have distinct advantages like a strong network and a higher level of financial resources and human capital. Furthermore, several factors to pursuing entrepreneurship later in life are earning income after retirement, the yearning to pursue a lifelong dream, and the desire to be mentally engaged in work.
There is a strong correlation between age and entrepreneurship. Previous research has revealed that fewer younger people engage in franchising (Gaille, 2017) and might not perform as well in many instances compared to older entrepreneurs (Shane, 2008). According to the U.S. Census (2020), over half of U.S. business owners were 55 and over. Approximately 43% of U.S. business owners were in the 35 to 54 category, and only 6% were 34 and younger. Hipple and Hammond (2016) similarly suggest raising financial capital for their ventures is one of the most significant challenges for younger entrepreneurs. This obstacle makes it more difficult for this group to acquire more attractive franchises because it is often a more considerable investment than other entrepreneurial opportunities. According to Bohlman et al. (2017), some abilities, such as physical strength, tend to decline as people age. However, other abilities, such as knowledge and skills, are maintained or increased.
Hypotheses
Industries vary in growth rates, profitability, competition, barriers to entry, and work environment. Industries with higher growth rates and less competition are more profitable, and a positive work environment is likely to produce significant differences in satisfaction levels across industries. Moreover, studies on non-franchisee entrepreneurs suggest that industry choice is essential to success when selecting a business type. It, therefore, follows that:
H1: There are significant differences in job satisfaction between industries in owning and operating a franchised business (M1≠ M2≠ M3).
Next, studies suggest that older entrepreneurs might have a distinct advantage in owning and operating a franchise due to higher human and financial capital levels. These advantages provide older entrepreneurs with more opportunities in franchising and are likely to produce significant differences in satisfaction levels across age cohorts. It, therefore, follows that:
H2: There are significant differences in job satisfaction between age categories in owning and operating a franchised business (M1≠ M2≠ M3≠M4).
Methodology
This portion of this study includes all parts of the research methodology in replicable detail. It starts with a description of the following: the research design, the population, sampling method, contact and participation consent, data collection, the research tool, and the independent and dependent variables used in the research. A seven-step model was used to evaluate the hypotheses.
Research Design
A comparative research model was chosen to investigate the hypotheses and determine the variations in job satisfaction levels between three franchising industries and four age cohorts. Therefore, the independent variables for this research are industry type and age cohort. The dependent variable is job satisfaction. The database used for this follow-on study came from a survey tool taken from June 15, 2013, to July 15, 2013, and reported in the 2015 study conducted by McDermott, Boyd, and Weaver (2015). The survey was mailed to prospective participants using a two-step method. The initial contact provided an overview of the research, followed up one week later with a package containing survey directions, the survey, a form of consent to participate in the study, and a return addressed envelope with postage.
Population and Sampling Method
The population for this research is business owners acting under a franchise contract. The franchisees were in the United States market and only owned one single unit at the time of the survey. The number of industries selected for this study was limited to Cleaning and Maintenance Services, Business Products and Services, and Home Repair and Improvement Services. These three industries were chosen for the original 2015 study because they were popular with military veterans. Four franchise brands were randomly selected from each industry, yielding 12 brands. A compiled list of franchisees based on the population conditions was purchased from Frandata, a market research firm specializing in franchising. The list included the business owner’s name and mailing address. Frandata provided a comprehensive list of 4,167 franchisees, and 1,280 names were selected using a stratified random sampling technique.
Instrument and Variables
This study used a self-administered mailed survey. Survey contents were selected from the Minnesota Satisfaction Questionnaire (1977). The Minnesota Satisfaction Questionnaire was chosen for its alignment with the study and high reliability. The Minnesota Satisfaction Questionnaire includes 20 items and uses a five-point Likert scale from not satisfied to extremely satisfied on various factors relating to job satisfaction. Therefore, the Minnesota Satisfaction Questionnaire range is from 0 to 100, with 0 being the lowest and 100 the highest level of job satisfaction.
The independent variables for this study are industry type and age category. The industry category was obtained by asking survey participants to circle the category/industry that best describes their franchise, followed by three choices: Business Products and Services, Maintenance and Cleaning Services, or Home Repair and Improvement Services. Age was obtained by asking survey participants to circle their age category, 20-30, 31-40, 41-50, 51-60, or 61 & over. The dependent variable included job satisfaction. The following section will cover the results of the survey.
RESULTS
This section presents the findings from the survey. All the data was evaluated using IBM SPSS, Version 28. It includes descriptive statistics, tests of homogeneity of variance, ANOVA, post-hoc tests using Tukey, and means plots. In this survey, 251 individuals participated from the original sample of 1,280 generating a response rate of 19.6%. The descriptive statistics for the dependent variable, job satisfaction, indicated that skewness and kurtosis were between the ±1.00 levels, suggesting a normal distribution bell curve. Cronbach’s alpha, a measure of internal consistency, reported .89 on the Minnesota Satisfaction Questionnaire. A general summary of sample characteristics is provided in Table 1.
Results from tests of the Hypotheses
A one-way between-groups ANOVA was applied to compare the means for job satisfaction for the industry category and age group to reduce the possibility of a Type 1 error. By its very nature, ANOVA decreases the risk of a Type 1 error. Alpha was set at .05. Table 2 exhibits the descriptive statistics for industry type with job satisfaction as the dependent variable.
First, to ensure we have not violated the assumption of homogeneity of variance (equal variances across the three groups), SPSS calculates the variance for the industry as the independent variable using a Levene statistic: F(2, 248) = .240, p = .787. The Sig value was >.05, so the null hypothesis is accepted. Since the variances were equal, the ANOVA assumption of homogeneity of variance was not violated. Next, Table 3 shows the output for the one-way between-groups ANOVA for the independent variable “Industry Category” with job satisfaction as the dependent variable.
A statistically significant difference was found between the three industries for job satisfaction. Therefore, the next step was to apply a Tukey post hoc comparison to determine how the three industries, Business Products & Services, Maintenance & Cleaning Services, and Home Repair & Improvement Services, varied in job satisfaction, as shown in Table 4.
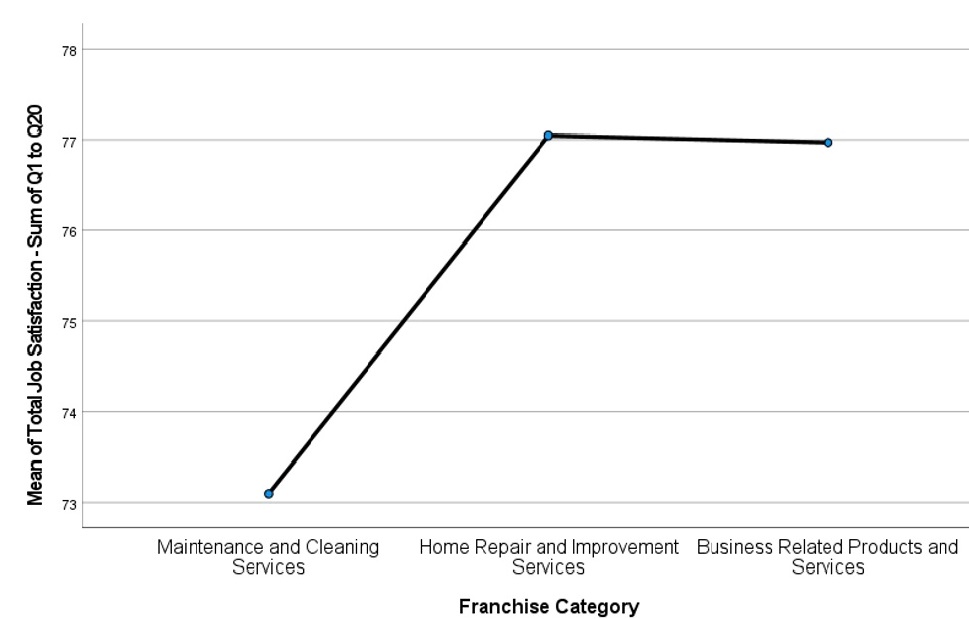
Figure 2 illustrates a means plot for the differences in job satisfaction between industry categories.

The Maintenance and Cleaning services category had significantly lower job satisfaction than the Home Repair and Improvement and Business Products and Services categories.
The same process was applied to the age category. Table 5 shows the descriptive statistics for the age category with total job satisfaction as the dependent variable. Fourteen participants did not include their age in this study, and only one participant was in the 18–30-year-old category. Therefore, these individuals were not accounted for in comparing job satisfaction.
Next, to ensure we have not violated the assumption of homogeneity of variance (equal variances across the four groups), SPSS calculated the variance for age as the independent variable using a Levene statistic: F(3, 232) =2.396, p = .524. The Sig value was >.05, so the null hypothesis is accepted. Since the variances were equal, the ANOVA assumption of homogeneity of variance was not violated. Table 6 shows the output for the one-way between-groups ANOVA for the independent variable “Age Category” with job satisfaction as the dependent variable.
There were no significant differences between the age groups for job satisfaction at the alpha level of .05. The following section will discuss, conclude, and make recommendations based on our findings.
DISCUSSION
This study fills a gap in two areas in franchising: the impact of industry selection and age on satisfaction and success of owning and operating a franchise. The hypotheses for this study suggested that industry category and age cohort of the franchisee would impact the job satisfaction level of owning and operating a franchise. Nevertheless, only one of the two hypotheses showed a significant difference in satisfaction. This research showed statistically significant differences in job satisfaction between the three industries selected for this study. According to Knatko et al. (2016), most scholarly studies on entrepreneurship infrequently address industry choice as a facet of the entrepreneurial decision-making process. As Shane (2008) suggested, many entrepreneurs mistake selecting industries they are familiar with, and the barriers to entry are low. Based on the outcomes of this study, industry consideration should be a top priority when considering an entrepreneurial endeavor, specifically a franchised business.
In this research, the maintenance and cleaning services industry had significantly lower job satisfaction than business services and home repair and improvement services. Scholarly literature suggests there are several antecedents to job satisfaction. Examples include money (Baack, 2012), leadership (Ahmed & Ahmad, 2011), employee recognition (Abraham, 2012), self-managed teams (Dubrin, 2002), flextime (Abraham, 2012), promotional opportunities (Ahmed & Ahmad, 2011), benefits (Abraham, 2012), and work environment (Baack, 2012). For instance, one area of consideration might pertain to the work environment in the maintenance and cleaning services industry. It is not uncommon for owners/operators to perform this work during grave shift hours, with little or no interaction with people. We find this notion consistent with the outcomes of the Hawthorne studies, which indicated that individuals’ work performance relies on social factors.
Another factor in industry selection might pertain to resource scarcity theory. Cetindamar et al. (2012) suggests that the purpose of becoming or not becoming an entrepreneur is based on access or possession of resources. Knatko et al. (2016) indicate that the most critical resources to successful entrepreneurship are access to financial and human capital and the experience and know-how acquired by an entrepreneur. The maintenance and cleaning services industry is typically a lower-cost industry in franchising. As a result, this industry might have more competition, yielding lower prices, revenue, and profits. For some individuals, the desire to become an entrepreneur might exceed the importance of industry choice. As a result, they make a poor choice in industry selection.
Age was another variable analyzed in this study. Resource scarcity also applies to the age category because younger entrepreneurs typically have less financial capital. As a result, younger entrepreneurs might choose less attractive industries. Previous research suggests that fewer younger individuals take part in franchising (Gaille, 2017) and do not perform as well in many instances compared to older entrepreneurs (Shane, 2008). In this study, only one participant noted they were in the 18- to 30-year-old category, and only 20 participants were in the 31–40-year-old category. The largest group was in the 51–60-year-old category, with 93 participants. This result confirms that franchising is more popular with older entrepreneurs. This study indicated no significant difference in satisfaction between the four age categories measured for this group. This outcome suggests that younger entrepreneurs can be equally as successful in franchising.
Limitations
There are several limitations to this study. First, this research did not evaluate control variables such as the current sales performance of the franchise unit and the number of years in business which could also influence entrepreneurial satisfaction. Moreover, there are intrinsic limitations in obtaining causal deductions concerning the antecedents of satisfaction. Next, this study focused only on individuals who owned one single franchise unit, affecting the conclusions’ generalizability. Another limitation is that this survey only included three out of several hundred industries currently using franchising to distribute, limiting the generalizability of the discoveries. However, the three industries were judged as prevalent categories and reasonably representative of franchising in the United States. Lastly is the limitation of non-response bias. For many mailed surveys, some types of respondents are likely overrepresented, and others are underrepresented in the sample received, creating biased results.
Implications for Practice
There are several suggestions for practice that could be concluded from this research.
First, entrepreneurs seeking to buy a franchise should invest considerable time researching the industry. Kotler and Keller (2016) suggest industries are categorized by factors that include the number of sellers in an industry, entry factors, globalization, the amount of vertical integration, costs, exit obstacles, and mobility. One popular tool available to entrepreneurs to analyze various industries is the North American Industry Classification System (NAICS). According to the United States Census Bureau (2022), NAICS is the benchmark used by Federal statistical agencies in categorizing businesses to gather, examine, and circulate statistical data associated with the U.S. business economy.
Michael Porter’s Five Forces model is another effective tool for analyzing industry attractiveness. The five forces described by Porter (1979) include the bargaining power of buyers, the bargaining power of suppliers, the threat of new entrants, the threat of substitute products or services, and rivalry among existing competitors. Moreover, we propose that entrepreneurs go beyond the conventional five forces suggested in Porter’s model when analyzing industry attractiveness submitted by Isabelle et al. (2020). These supplementary forces of consideration include the threat of digitalization, exposure to globalization, competitors’ level of innovativeness, and industry exposure to de/regulation. These additional forces to Porter’s Model on industry attractiveness can significantly affect a business’s success or failure.
The following recommendation applies to franchisors. This study indicated that age had no impact on franchisee success and satisfaction. However, franchising could be more expensive than other entrepreneurial ventures, so it is more popular with an older cohort. As noted in this study, one of the biggest challenges for franchisors is identifying qualified franchisees that match their model. Franchisors could find more qualified franchisees within the younger cohorts. One solution to overcoming the financial barrier for younger franchisees is to create more streamlined, less expensive franchise models. One example of this notion could be a kiosk or home-based model. As a younger franchisee starts building the business, they can eventually move to a full-scale model for the franchise.
While age may not be a factor in franchise success and satisfaction, franchisors need to consider the differences between the generational cohorts, which include Baby Boomers, Generation X, Millennials, and Generation Z. According to DelCampo et al. (2011), each age cohort has different beliefs, expectations, learning styles, and aspirations. Understanding these differences can help lead, train, and market to these different age groups. For example, according to Ng and Feldman (2013), one stereotype identified for older workers like the Baby Boomers is that they are less innovative and more resistant to change. Interestingly, being less innovative may be fine for franchisors because they want their franchisees to follow the system rather than recreate the wheel. However, resistance to change can be a challenge for older franchisees.
Next, according to Kotler and Keller (2016), GenXers are known to be independent. In addition, they regard technology as an opportunity. Moreover, compared to Millennials, they are more individualistic and practical. Franchisors might see these factors as noble traits in considering a franchisee for their system. Kotler and Keller (2016) describe Millennials as having a high level of social consciousness, being concerned about environmental matters, and being responsive to cause marketing campaigns. The Great Recession had a significant impact on the Millennial group. As a result, many Millennials have accumulated sizable debt. This notion might be a challenge for franchisors recruiting from this segment. Solomon (2017) also suggests that Millennials tend to hold traditional values and the desire to conform rather than rebel. Conformity can be seen as a vital trait for franchisees because it is critical to follow the system created by the franchisor. In addition, Millennials are partial to team settings and activities and likely to multitask. According to DelCampo et al. (2011), Millennials have high expectations of employers and expect to be treated as equals upon entering the workforce. Moreover, younger generations tend to work better in a group setting, predicting that the workplace will migrate toward more teamwork and group-centered projects. These characteristics could determine if a Millennial is a good fit for a particular franchise system. The last cohort is Generation Z, those individuals born in the United States between 1997 and 2012. Statista (2022) suggests there are over 68 million individuals in this cohort. Many of these individuals have recently begun college. Solomon (2017) states that Generation Z is the most culturally diverse cohort. In addition, many of them have friends from other cultures. Moreover, they have been tagged “Digital Natives” because they spend a lot of time online. Furthermore, they expect brands to engage them in a two-way conversation. These factors might play a role in recruiting this cohort, particularly in the future.
Future Studies
There are several suggestions for future studies drawn from this research. This study included three out of several hundred industries presently using franchising as a means of distribution, restraining the generalizability of the findings. It would be interesting to learn about differences in satisfaction levels amongst three common industries in franchising, like food, children’s services, and pet care.
Next, this study focused on individuals who owned one single franchise unit. However, a segment of franchisees owns several franchise units. These individuals are characterized as multi-unit franchises. It would be interesting to learn if multi-unit franchisees have higher or lower satisfaction levels than single-unit franchisees.
Lastly, this study suggested that the maintenance and cleaning services industry had significantly lower job satisfaction than business services and home repair and improvement services. It would be noteworthy to explore as a qualitative study why franchisees scored significantly lower in job satisfaction compared to business services and home repair and improvement services. For example, Morrison (1996) identified several areas of dissatisfaction in owning and operating a franchise that included continued support from the franchisor, advertising assistance, and income levels generated. Revisiting this topic could support these findings and identify additional areas of dissatisfaction.
Conclusions
This research makes several contributions. This study used job satisfaction as a gauge for success. First, although much research suggests that entrepreneurs in older cohorts have distinct advantages like financial capital and experience, this study showed age was not correlated to higher satisfaction in owning and operating a franchise. Moreover, many scholarly studies on entrepreneurship infrequently address industry choice as a part of the entrepreneurial decision-making process. This study suggests the industry category had a significant difference in job satisfaction levels suggesting aspiring entrepreneurs seeking to buy a franchise should apply considerable time and diligence in selecting an industry.